Generic or Specific Data in LCA: How Do You Ensure the Right Data Quality?
Collecting Life Cycle Inventory (LCI) data for the entire value chain — from raw materials and transport to production, use, and end-of-life management — can feel extensive. At the same time, it is rarely necessary or reasonable to have primary data at every stage. The question is therefore not whether you should choose generic or specific data, but where it makes the greatest difference to the credibility and usefulness of the results. If you are unsure what data you need, we recommend seeking support from an experienced life cycle analyst to ensure that you focus on the relevant parts of the value chain.

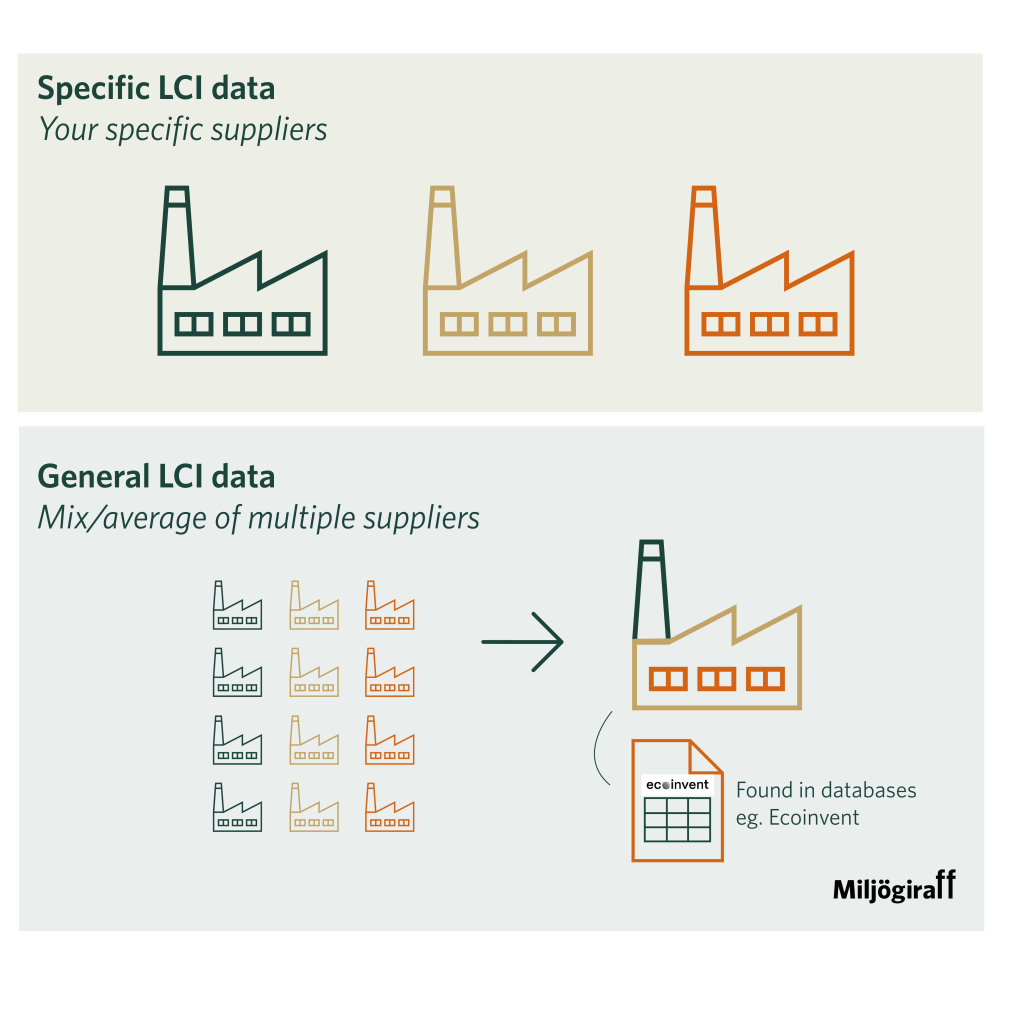
What Are Generic and Specific LCI Data?
Specific primary LCI data describes your actual process or product. It is collected where you, or your supplier, have operational control — for example, the actual electricity mix, energy use per process step, material consumption, and waste.
Generic secondary LCI data represents an average or typical scenario for a region, technology, or time period. It is often taken from databases such as ecoinvent and makes it possible to model complex value chains.
When Is Generic Data Sufficient in an LCA?
Generic data is often a wise starting point. It makes it possible to model the entire life cycle, identify preliminary hotspots, and create an initial baseline without extensive data collection.
Generic data is particularly suitable when:
- you are conducting a screening LCA
- you lack control over parts of the supplier chain
- flows have little impact on the result
- the goal is an overview rather than external publication
Generic data makes LCA practically feasible. But when the analysis is to be used for decisions or communication, the requirements for representativeness increase — meaning specific data for your processes.
When Do You Need Specific Primary Data in Your LCA?
Specific data should be used to a greater extent to represent your value chain when the results will form the basis for:
- EPDs
- customer communication
- procurement
- investment decisions
- follow-up of climate targets
If you have operational control over a process, such as your own production or energy use, it is expected to be described using your actual data, especially in an EPD context.
Primary data is also crucial when you have made improvements and want them to be reflected in the results. Have you switched to renewable electricity, reduced waste, or made production more efficient? Then the model should reflect that — otherwise, the LCA becomes static and the improvement remains invisible.

What Data Quality Do ISO 14044 and EPD Systems Require?
Both ISO 14044 and various EPD programmes set requirements for data quality, but in slightly different ways.
In essence, ISO 14044 says: use data that actually fits the purpose of your study, and be transparent about what is uncertain.
This means that you may use generic data. But you must be able to explain why it is reasonable, how well it reflects reality, and what limitations exist. In other words, it is not enough to “take something from the database” — you need to justify your choice.
EPD systems are more concrete. In general, if it is your own production, it should be described as far as possible using your own data. If you have control over the process, you are also expected to measure it. This may vary between different product categories. Specific rules on data quality are described in the PCR, Product Category Rules, for the specific product being analysed.
An EPD also places high demands on documentation. Data quality must be described clearly enough for an external reviewer to understand how representative it is — geographically, technically, and temporally.

When Can Generic Data Be Misleading?
Generic data often represents the right type of process, but not necessarily your reality. It is based on an average: a certain region, a certain technology level, and a certain time period. In practice, your production may differ significantly from that assumption.
Geographical differences may mean a completely different electricity mix, different transport distances, or different access to fuels. Differences in technology and efficiency may mean that your facility is more resource-efficient than the average, or the opposite. For material-intensive products, even small variations in material use or waste levels can have a clear effect on climate results. When these differences are not captured in the model, the analysis risks describing “how it usually looks” rather than how it actually looks.
The problem arises when the results are used to make decisions. If a generic model points to the wrong part of the life cycle as the greatest climate burden, resources, investments, and development efforts may be directed incorrectly. It may also mean that real improvements — such as switching to renewable electricity or more efficient production — do not show up in the results.
In that situation, data quality is no longer a technical detail in the methodology section. It determines whether the LCA gives the right signals to the organisation. When the analysis is used as a basis for an EPD, procurement, product development, or climate strategy, representativeness becomes a strategic issue because it affects both credibility and the direction of your decisions.

How to Work Step by Step with Data Quality in LCA
Use generic data to get started, but switch to specific data where the results are affected the most. Databases such as ecoinvent are useful and often essential for carrying out LCA in practice. But if the ambition is to move from mapping to change, you also need to capture the reality of your own value chain.
Experienced life cycle analysts often know where specific data is needed and where it is not. If there is uncertainty, we usually recommend:
- Model the entire life cycle using generic data.
- Identifiera de största klimatbidragIdentify the largest climate contributions.en.
- Secure primary data for these parts.
- Update the model over time.
In this way, the LCA becomes an improvement tool rather than a one-off report.

Example: When the Right Data Level Creates Real Impact
In our work with Bistål, we found major improvements by updating the EPD with specific data.
In the first version of the EPD, there were challenges in collecting specific data from all stages of the supply chain, so some parts were represented by generic datasets. The result identified energy consumption in the process steps as a clear hotspot.
With these insights, Bistål chose to:
- initiate more supplier dialogue to obtain specific manufacturing data
- switch to renewable electricity in production
The effect was very significant: a 62–67% reduction cradle-to-gate and a 50–58% reduction cradle-to-grave for their products, and an updated EPD could be produced. The updated EPD improved Bistål’s competitiveness.
The lesson: the EPD did not become just a PDF — it became an iterative improvement process, where better data enabled better decisions and ultimately led to increased competitiveness in the market.