Environmental spend analysis
An environmental spend analysis offers the opportunity to calculate the environmental impact from a life cycle perspective based on financial data such as a budget. When an organization uses a large quantity of products and services, conducting LCAs to assess the impact per product or service is not an optimal approach. In such cases, Environmental Spending Analysis is a good alternative An environmental spending analysis is suitable for large organizations or municipalities and regions that want to understand their total environmental impact from a life cycle perspective. Environmental spending analysis can also be used to calculate indirect climate impact in GHG Scope 3 or develop carbon budgets.
How to conduct an environmental spend analysis
2. Classify with database
3. Calulate with SimaPro
4. Create calculation tool
5. Document in report
6. Improve with specific data
Steg 2 Define categories
Based on the organization’s financial flow, purchases, and expenses, categories from your chart of accounts are defined.
Steg 2 Classification
We classify the categories so they match categories in the Exiobase database. Exiobase contains categories representing the most common expense items in the global economy and can be linked to environmental impact.
Step 3 Calculate
To calculate the environmental impact, the categories are imported into SimaPro (LCA software), where the environmental impact per currency spent is calculated. In SimaPro, the IPCC 2021 GWP 100 method is used to calculate the total climate impact for all greenhouse gases emitted. With the IPCC method, all climate impacts are converted to kg CO2 equivalents. There is also the possibility to obtain results from more environmental impact categories using other environmental impact assessment methods.
Step 4 Create calculation tool
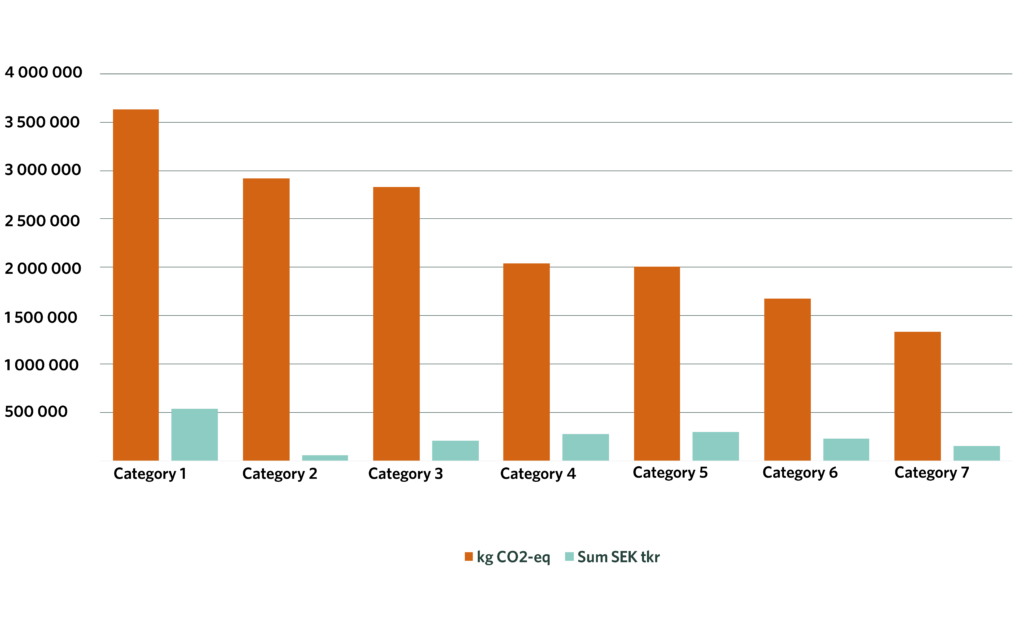
The results are exported to Excel, where a Pivot table of the organization’s recorded expenses is calculated. The Excel document and Pivot table come with the first year’s expenses entered, with the possibility to add subsequent years so the organization can follow development over time. Through the Pivot table, the results can be distributed by individual categories or aggregated at various category levels in accordance with the structure of the chart of accounts. The Pivot table also provides the ability to sort the results by the categories or levels of category that contribute most to the overall climate impact or per currency spent, which in turn offers the opportunity for deeper analysis and understanding of the results.
Step 5 Report
Everything is documented in a method report that is delivered along with a presentation and Miljögiraff’s interpretation of the results as well as recommendations.
Step 6: Improve with Specific Data (Recommended)
A recommended next step is to enhance the data from the environmental spending analysis with process LCA data. This means that the categories are converted into kilograms of material or amounts of energy. By adding more specific data, one can leverage a higher level of detail in the result and understand what in the life cycle contributes to environmental impact, as well as when in the life cycle this occurs within a certain category. This, in turn, enables clearer action plans and further support in reduction strategies. It’s also possible to incorporate specific Life Cycle Inventory (LCI) data or Environmental Product Declarations (EPDs) for a particular supplier.
This step is not included in a classic environmental spending analysis but is something we at Miljögiraff can assist with and recommend.
The results of an environmental spend analysis are delivered with:
- Report a document that documents and describes the environmental spending analysis in a scientific manner, where the methodology is clear and the results are transparent and reproducible. The report also contains recommendations on how the environmental impact can be reduced based on the results.
- Presentation and workshop of results focusing on possible improvements in the purchasing categories that generate the most environmental impact.
- MS Excel tool with compilation in pivot diagrams and calculation of the organization’s greenhouse gas emissions based on purchases. The calculation is presented according to purchasing categories in the organization’s own chart of accounts and can be reported broken down by different parts of the organization and years. This tool can be used to calculate the upcoming or previous year’s impact as long as the same chart of accounts is used.
Database – Exiobase

ChatGPT Miljögiraff conducts environmental spending analysis using the Exiobase database, which is based on economic input/output tables. Within economics, an Input/Output model represents the interdependence and transactions between different sectors of a national economy. By then linking this economic flow with various environmentally impactful flows, such as the generation of carbon dioxide, a connection between economic flow and environmental impact can be established. This provides a relationship between the amount spent in a specific category of the economy and a certain amount of greenhouse gases, which in turn makes it possible to calculate climate impact solely based on monetary values. In Exiobase, this connection exists for 169 different categories representing the most common expenditure items in the global economy.
Read more about Exiobase on their website

